Mideye Server 5 Dashboard and RADIUS Sessions
Overview
Section titled “Overview”The Web GUI dashboard provides real-time monitoring of authentication activity, server health, and RADIUS sessions.
Dashboard overview
Section titled “Dashboard overview”After authenticating to the web GUI, a dashboard is presented with a quick overview of today’s authentication logs and the health of the server.
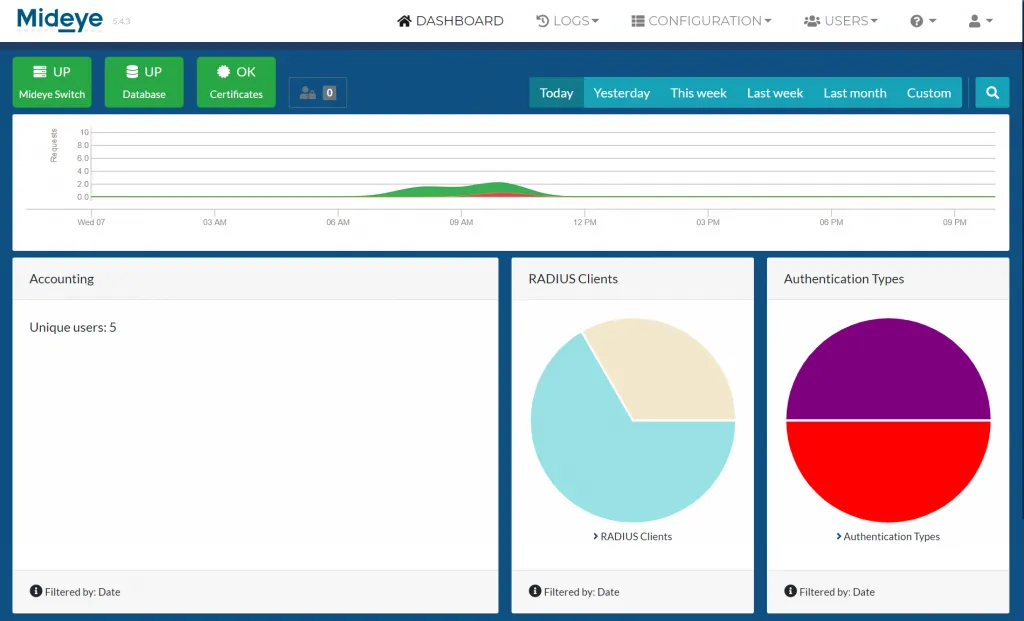
- Mideye switch and database status: The top left corner will show two icons with the health of the connection to the central Mideye services and status of the database. Both these should always be green.
- The graph below the icons shows all authentication attempts during the timeline selected to the right.
- The row below the graph gives an overview of the number of unique users, what RADIUS clients that have been used followed by authentication types and failed logins.
- The last row shows all authentication attempts over the selected period of time.
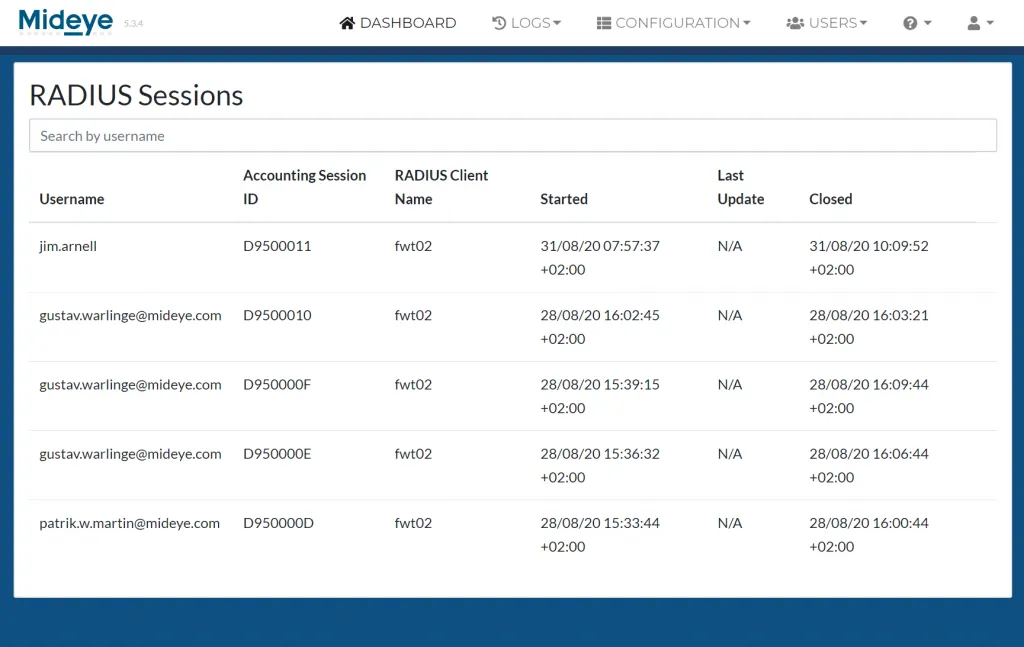
RADIUS Sessions
Section titled “RADIUS Sessions”All RADIUS clients that supports RADIUS Accounting will send accounting to Mideye Server. Each accounting sent includes timestamps when the sessions started and when the session is closed. If supported by the RADIUS client, updates will also be logged.