Mideye Server 4 Logging and Diagnostics Guide
Overview
Section titled “Overview”Need to troubleshoot MFA authentication failures or monitor RADIUS traffic? This guide explains how to configure logging and diagnostics for Mideye Server 4, including log files, Syslog integration, Windows Event Viewer, SNMP traps, and real-time RADIUS tracing.
Log Configuration
Section titled “Log Configuration”Mideye Server offers multiple logging options for monitoring authentication events and troubleshooting issues. Changes to logging settings take effect immediately without restarting Mideye services.
| Logging Option | Purpose | Best For |
|---|---|---|
| Log File | Local RADIUS message logging | Basic troubleshooting |
| Syslog | Remote centralized logging | SIEM integration |
| Event Viewer | Windows event logging | Windows administrators |
| SNMP | Network management traps | Enterprise monitoring |
| RADIUS Trace | Real-time detailed logging | Active debugging |
Log File
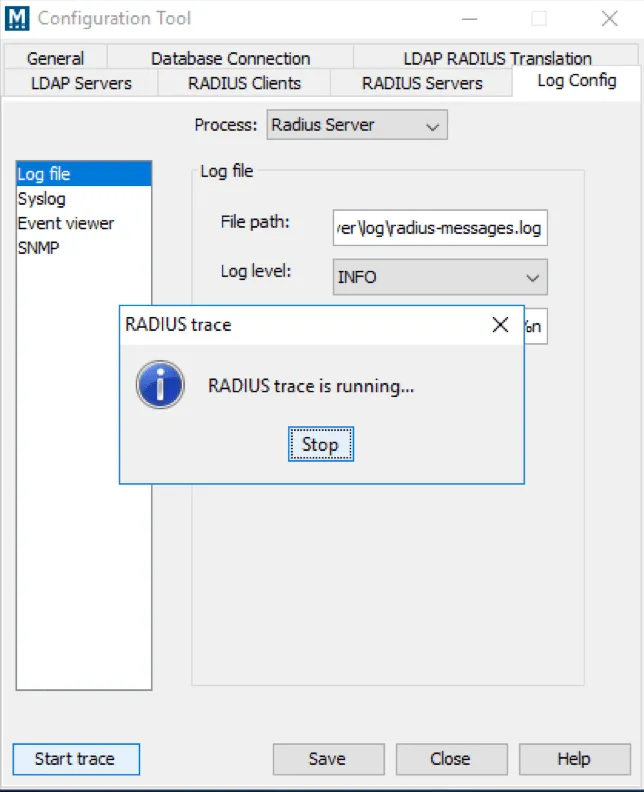
Section titled “Log File”The default location for RADIUS messages is \log\radius-messages.log. The logging level is set to info but can be customised.
Syslog
Section titled “Syslog”To enable syslog, check the “Enable” button and specify the IP address to the syslog server.
Event Viewer
Section titled “Event Viewer”If Mideye server is installed on a Windows platform, Event Viewer can be enabled. This will log all error messages.
To enable SNMP, check the “SNMP” button and specify the host, port and community of the SNMP server.
Start Trace
Section titled “Start Trace”At the left bottom corner of the window a “Start Trace” button is available, and is used to troubleshoot various problems with the Mideye Server. When this button is clicked, all information will be sent to a file named trace.log until the trace is stopped. This log file is located in the log folder named RADIUSTrace.log.
The trace will not affect the production traffic, but be advised that these files quickly becomes big in size.